How to Measure Generative AI Adoption: Telemetry, Surveys, and ROI

- Mark Chomiczewski
- 5 August 2026
- 0 Comments
You bought the licenses. You sent the training emails. But now comes the hard part: proving that your team is actually using generative AI tools and getting value from them. Most leaders are flying blind, relying on gut feelings or vanity metrics like "number of logins" that tell you nothing about productivity. If you want to know if your AI strategy is working, you need a measurement framework that goes beyond simple usage counts.
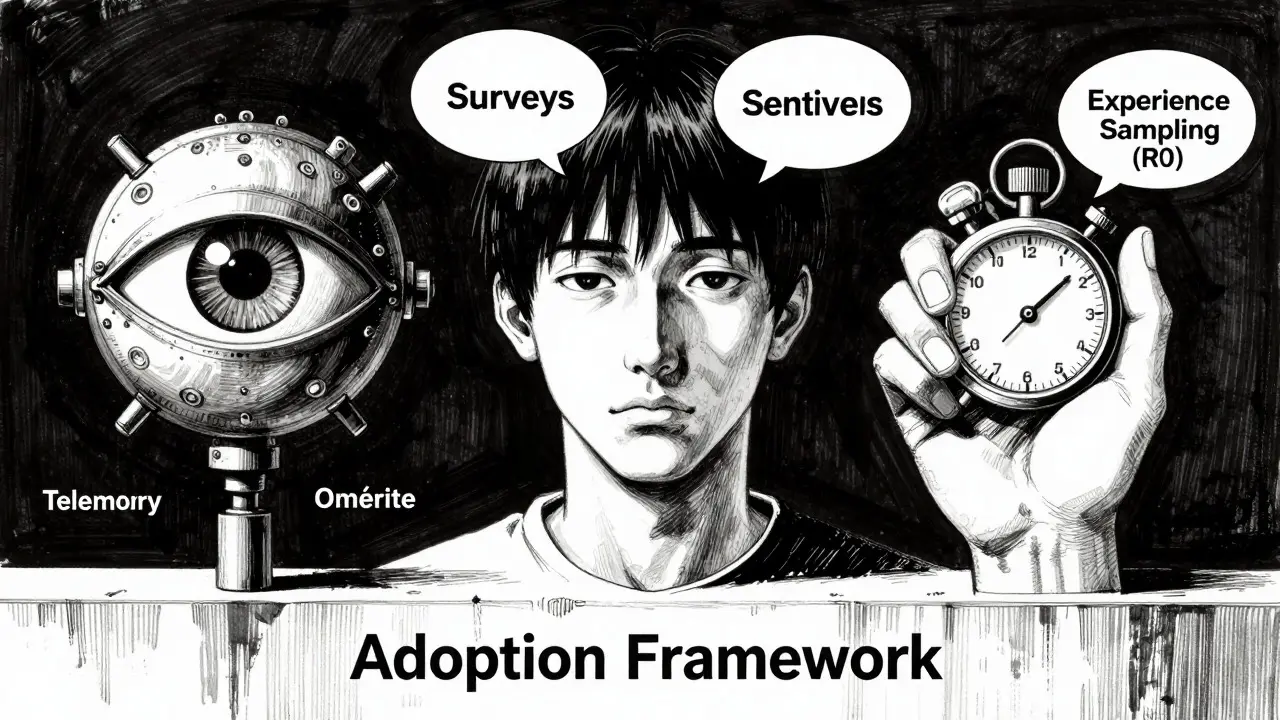
Measuring adoption isn't just about counting heads; it's about understanding behavior, impact, and return on investment. The most effective approach combines three distinct methods: telemetry (objective usage data), surveys (self-reported sentiment and breadth), and experience sampling (specific task-level ROI). Relying on just one leaves massive gaps in your data. Let’s break down how to build a system that gives you the full picture.
The Truth in Telemetry: Objective Usage Data
Telemetry captures direct, real-time signals from the software itself. It doesn’t ask users what they think; it records what they do. This is the bedrock of any serious adoption strategy because it removes human bias and recall error. When developers use GitHub Copilot or when marketers use Microsoft Copilot in Word, the platform logs every interaction.
To get actionable insights, you need to track specific high-value metrics rather than generic activity. For engineering teams, look at data points provided by platforms like LinearB. Key indicators include:
- Daily Active Users (DAU): Broken down by team or group to identify silos where adoption is lagging.
- Acceptance Rate: How often do users accept AI-suggested code? A low acceptance rate suggests the tool isn’t helpful or the prompts are poor.
- Cycle Time: Does the time from commit to merge decrease after AI integration?
For non-technical roles, workplace intelligence platforms like Worklytics integrate with Microsoft 365 to track prompt frequency across Word, Excel, and Outlook. Worklytics benchmarks suggest beginner teams generate 15-30 prompts per employee per month. If your numbers are significantly lower, you have an engagement problem. If they’re higher, you might be seeing genuine productivity gains.
However, telemetry has limits. It tells you that something happened, but not why or how well. A developer might spend ten minutes tweaking a prompt that eventually fails. Telemetry sees the activity, but misses the frustration. That’s why you need the other two methods.
Surveys: Measuring Breadth and Sentiment
While telemetry tracks behavior, surveys capture perception. They answer questions like: Do employees feel confident using these tools? Are they aware of all available features? Surveys are essential for measuring the "spread" of adoption across the organization.
Design matters immensely. Research from Harvard’s Project on Working highlights a critical pitfall: question sequencing changes results. In August 2024, their initial survey showed 39.4% genAI usage among U.S. adults. By revising the order of questions regarding awareness versus actual use, the reported adoption jumped to 44.6%. Small changes in wording can drastically alter your baseline data.
When designing your internal surveys, focus on:
- Adoption Rate: What percentage of employees use the tool weekly?
- Satisfaction: On a scale of 1-10, how much does the tool help your daily work?
- Barriers: What stops you from using it more? (e.g., trust issues, hallucinations, slow speed).
Be aware of self-reporting bias. Employees may overstate productivity gains to look good or understate them due to fear of job replacement. Always cross-reference survey claims with telemetry data. If everyone says they’re saving hours, but cycle times haven’t moved, dig deeper.
Experience Sampling: Quantifying Real ROI
This is the missing link for most organizations. Telemetry shows usage; surveys show sentiment. Experience sampling connects usage to business value. It involves targeted inquiries that ask users to report time saved on specific tasks immediately after completion.
Instead of asking, "Did AI save you time this month?" (which invites vague guesses), ask, "You just used Copilot to draft that email. How many minutes did it take compared to writing it from scratch?" This granular data allows you to extrapolate total estimated ROI in dollars and hours.
GetDX’s analysis notes that this method provides insights difficult to obtain otherwise, such as exact minute savings on development tasks. It bridges the gap between aggregate metrics and executive-ready financial justification. However, it requires active participant engagement. To make it work, keep the sampling lightweight-perhaps one quick popup per week per user-to avoid survey fatigue.
Combining Methods for a Complete Picture
No single method is perfect. The goal is triangulation. Use this framework to interpret your data:
| Method | Best For | Key Limitation | Example Metric |
|---|---|---|---|
| Telemetry | Objective usage intensity | Lacks context on quality/satisfaction | Prompts per user/month |
| Surveys | Breadth of adoption & barriers | Self-reporting bias & recall error | % of staff using AI weekly |
| Experience Sampling | Specific task ROI & time savings | Requires user effort/compliance | Minutes saved per task |
If telemetry shows high usage but surveys show low satisfaction, you likely have a "zombie adoption" scenario where people use the tool out of habit but find it frustrating. If surveys show high interest but telemetry is low, you have a training or access barrier. Experience sampling helps validate whether the high usage is actually translating to efficiency.

Common Pitfalls to Avoid
Many companies fail at measurement because they chase vanity metrics. Avoid these traps:
- Ignoring Attribution: Did code review time drop because of AI, or because the project was simpler? Use multivariate analysis to isolate AI’s contribution.
- Data Silos: Don’t measure Microsoft Copilot separately from ChatGPT Enterprise without a unified dashboard. Aggregation is key.
- Static Baselines: Adoption evolves. Establish baselines before deployment, then track longitudinally. The Federal Reserve’s monitoring reports highlight that adoption rates fluctuate based on economic conditions and tool updates.
Also, recognize geographic and role-based disparities. Microsoft Research data shows strong correlations between national wealth/internet infrastructure and AI adoption. Within your company, technical teams will adopt faster than administrative ones. Tailor your expectations and support accordingly.
Next Steps for Implementation
Start small. Pick one high-value workflow (e.g., customer support ticket drafting) and apply all three methods. Collect telemetry on prompt volume, survey agents on satisfaction, and sample time savings on specific tickets. Once you prove the model works, scale it across departments.
Automate your telemetry collection. Manual logging is unsustainable. Use APIs from your AI vendors to feed data into a central BI tool. Schedule quarterly surveys to track cultural shifts. And rotate experience sampling targets to keep fresh data flowing without annoying your staff.
Remember, the goal isn’t just to measure adoption-it’s to drive better outcomes. If your data shows low ROI in a certain department, don’t just cut the budget. Investigate. Maybe they need better prompt training. Maybe the tool isn’t right for their job. Measurement informs action.
What is the best way to measure GenAI ROI?
The most accurate way is through experience sampling combined with telemetry. While surveys provide broad sentiment, experience sampling captures specific time savings on individual tasks. By multiplying average time saved by hourly wage rates and scaling across the team, you can calculate a concrete dollar value for your AI investment.
Why do my survey results differ from telemetry data?
This discrepancy usually stems from self-reporting bias or recall error. Employees may believe they use AI more often than they actually do, or they may overstate productivity gains. Telemetry provides objective proof of usage frequency and intensity, serving as a reality check against subjective survey responses.
What are key telemetry metrics for developer AI adoption?
Key metrics include Daily Active Users (DAU), acceptance rate of AI-suggested code, lines of code generated vs. written manually, and reduction in cycle time (time from commit to merge). Tools like LinearB and GitHub Insights provide these data points automatically.
How often should I conduct AI adoption surveys?
Quarterly surveys are recommended for tracking longitudinal trends and cultural shifts. More frequent surveys lead to fatigue and lower response quality. Pair these with continuous telemetry data for a balanced view of both behavior and sentiment.
What is experience sampling in the context of AI?
Experience sampling is a research method where participants report on their immediate experiences, such as time spent on a task or perceived difficulty, right after completing it. In AI measurement, it helps quantify precise time savings and identify specific use cases where the tool adds the most value.