Measuring Generative AI ROI: Productivity, Quality, and Transformation Metrics
- Mark Chomiczewski
- 10 June 2026
- 9 Comments
Here is the hard truth about generative AI in business right now: most companies are flying blind. You have likely heard the conflicting headlines. One report claims 95% of generative AI projects fail to deliver measurable ROI, while another says 72% of organizations are seeing positive returns. How can both be true? The answer isn't that one side is lying; it's that they are measuring completely different things. If you are only looking at immediate cost savings, you will see failure. If you are looking at strategic capability and quality shifts, you might see success.
The gap between these two realities defines the current state of enterprise AI in 2026. We are moving past the hype cycle where simply buying a ChatGPT Enterprise license was considered a strategy. Now, executives need proof. They need to know if that $2 million annual investment is actually paying off. To get this answer, you cannot rely on traditional accounting formulas. You need a new way to measure value-one that captures productivity gains, quality improvements, and long-term transformation.
The Three Tiers of Gen AI Measurement
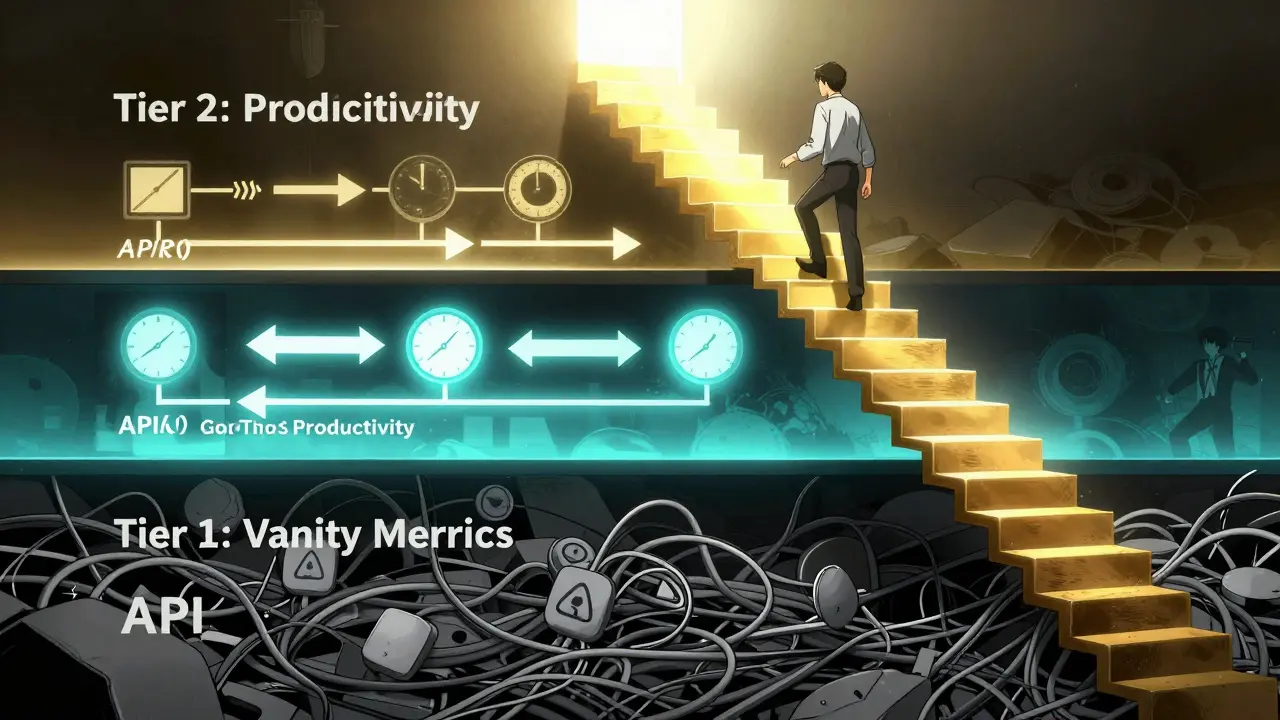
To make sense of the data, you need a structured approach. Research from Worklytics in 2025 broke down effective measurement into three distinct tiers. Think of this as a ladder. Most companies get stuck on the first rung because it is easy to measure. But the real money-and the real risk-is higher up.
- Tier 1: Action Counts (The Vanity Metrics). This includes API calls, daily active users, and token usage. It tells you if people are using the tool, but not if they are using it well. High usage here can sometimes mean inefficiency-users struggling to get good outputs rather than working faster.
- Tier 2: Workflow Efficiency (The Productivity Layer). This measures time saved per task, error reduction rates, and output volume. For example, did your marketing team cut draft creation time by 40%? Did your developers reduce bug reports by 15%? This is where "hard" productivity gains live.
- Tier 3: Revenue Impact (The Business Outcome). This connects AI use to profit. It tracks revenue per employee, client satisfaction scores (NPS), and incremental profit margins. This is the hardest tier to reach because it requires isolating AI’s impact from other market factors.
Organizations that stop at Tier 1 often cancel projects prematurely. They see high costs but no direct link to the bottom line. By the time Tier 3 benefits materialize, leadership has already pulled the plug. According to MIT’s 2025 'GenAI Divide' report, 68% of potentially valuable projects are canceled within nine months for exactly this reason.
Hard ROI vs. Soft ROI: What Are You Missing?
When finance teams ask for ROI, they usually want a single number: Net Profit divided by Investment Cost. This works for buying a machine that stamps out widgets. It does not work for cognitive tools that assist human thinking. You need to separate your metrics into "hard" and "soft" categories to get a complete picture.
| Metric Type | Key Indicators | Timeframe to Realize | Measurement Difficulty |
|---|---|---|---|
| Hard ROI | Labor hours saved, reduced operational costs, increased conversion rates (e.g., Adobe reported 22% higher conversions in CSC development) | Immediate to 3 months | Low (Easy to track via time-tracking software) |
| Soft ROI | Employee satisfaction (eNPS), quality of strategic insights, innovation speed (patent filings), reduced burnout | 3 to 6+ months | High (Requires surveys, qualitative analysis, and controlled experiments) |
Consider the case of a global law firm featured in Thomson Reuters’ 2025 report. They implemented Gen AI for legal research. Initially, the "hard" ROI looked mediocre. However, when they measured "soft" ROI, they found a 27% increase in billable hour utilization because lawyers spent less time on rote research and more time on high-value client strategy. More importantly, the quality of their legal briefs improved, leading to higher win rates in complex cases. That quality improvement is hard to quantify in dollars immediately, but it is the driver of long-term revenue.
IBM’s collaborative study with Adobe and AWS adds weight to this. Teams that adopted holistic AI best practices reported a median ROI of 55%. Those who focused only on content supply chain efficiency saw ROI 22% higher when they included strategic views. The lesson? If you ignore soft metrics like employee satisfaction-which jumped 18% in organizations that eliminated mundane tasks-you are ignoring a major part of the return.
The Strategic Alignment Factor
Why do some companies succeed while others fail? It comes down to strategy. Adopting Gen AI informally-letting employees buy their own tools and figure it out-leads to fragmented results. Organizations with formal AI strategies aligned to specific business goals achieve 2.3x higher ROI than those adopting AI ad-hoc, according to Thomson Reuters.
This alignment matters because it dictates how you measure. If your goal is customer support scaling, your metric is resolution time and CSAT. If your goal is product innovation, your metric is time-to-market for new features. Without a clear goal, you end up measuring everything and proving nothing.
Dr. Erik Brynjolfsson from Stanford HAI puts it bluntly: "We're applying industrial-era metrics to a cognitive-era transformation." Traditional ROI calculations miss the value of capability enhancement. A developer using GitHub Copilot might not code 50% faster in terms of lines written, but they might tackle problems 30% more complex than before. That complexity jump is a strategic asset, not just a productivity stat.
Implementation Roadmap: From Data to Dollars
You cannot measure what you do not track. But setting up a robust measurement framework takes time. Based on implementation data from 272 enterprise clients, here is a realistic timeline for building your Gen AI ROI engine:
- Weeks 1-4: Establish Baselines. Before you deploy any new AI tool, document your current performance. How long does a sales proposal take to write? What is the current error rate in code deployment? Deloitte notes that 89% of high-ROI organizations documented pre-implementation performance across 12+ KPIs. If you don’t have a baseline, you can’t prove improvement.
- Weeks 8-12: Track Tier 1 and Tier 2 Metrics. Monitor adoption rates and initial workflow efficiencies. Use unified analytics platforms to track usage across tools like Claude Enterprise, ChatGPT Teams, and Atlassian Rovo. Look for patterns. Are power users getting disproportionate value? Are certain departments resisting adoption?
- Months 4-6: Connect to Tier 3 Outcomes. This is where you run controlled experiments. Compare AI-enabled workflows against traditional ones. Attribute changes in revenue, NPS, or retention to the AI initiative. This step often reveals attribution difficulties, cited by 68% of organizations as a major challenge. Be prepared to use cohort analysis to isolate variables.
Don’t underestimate the cost of measurement itself. Organizations invest an average of $18,500 per measurement specialist, according to Deloitte. You need people who understand data analytics, business process mapping, and cross-functional collaboration. This is not a job for an IT admin alone; it requires business acumen.

Pitfalls to Avoid in 2026
As you build your framework, watch out for these common traps:
- The Time Lag Trap. Financial returns often lag behind productivity gains. If you measure monthly, you will miss the trend. Look at quarterly or semi-annual trends for Tier 3 metrics.
- Data Silos. 76% of organizations struggle with data silos, making it hard to connect AI usage in one department to revenue outcomes in another. Invest in unified analytics early.
- Ignoring Inference Costs. While inference costs for GPT-3.5 level systems dropped 280-fold between 2022 and 2024, they still matter. Ensure your ROI calculation includes the full cost of compute, not just the subscription fee.
- Premature Cancellation. Don’t kill a project because it didn’t show cash flow impact in month three. Evaluate its contribution to quality and capability first.
The Future of AI Measurement
We are heading toward automated attribution. Gartner predicts that by 2026, 70% of enterprises will use AI-powered analytics to automatically attribute business outcomes to specific AI initiatives, up from just 22% in 2025. Tools like Worklytics are already introducing predictive analytics that forecast AI ROI based on early adoption patterns with 83% accuracy at eight weeks post-implementation.
Regulatory pressure is also shaping measurement. The EU AI Act requires ROI transparency for high-risk applications, prompting 41% of European enterprises to enhance their frameworks in Q1 2025. This means measurement is no longer just a nice-to-have for CFOs; it is becoming a compliance requirement.
Ultimately, the companies that win with Gen AI won’t be the ones with the biggest budgets. They will be the ones with the clearest eyes. They will measure not just what the AI saves them, but what it enables them to become. By balancing hard productivity metrics with soft quality indicators and aligning them to strategic goals, you can turn the ambiguity of AI into a competitive advantage.
Why do so many generative AI projects appear to fail despite high adoption?
Many projects appear to fail because organizations use narrow, traditional ROI definitions that focus solely on immediate cost savings. MIT's 2025 report highlights that 95% of projects show zero ROI under these strict criteria. However, when measuring broader impacts like quality improvements, employee satisfaction, and strategic capability, success rates look very different. The mismatch between measurement methods and the nature of cognitive work creates this illusion of failure.
How long does it take to see a return on investment from generative AI?
It depends on the type of ROI. Hard productivity gains, such as time saved on drafting documents, can appear within weeks. However, financial ROI tied to revenue growth or profit margins typically takes 3 to 6 months to materialize. Some strategic benefits, like enhanced innovation capacity, may take even longer. Premature cancellation often occurs when leaders expect financial returns too quickly.
What are the key differences between hard and soft ROI metrics?
Hard ROI metrics are quantitative and directly tied to financial outcomes, such as labor hours saved, reduced operational costs, or increased conversion rates. Soft ROI metrics are qualitative or indirect, including employee satisfaction, quality of work, and innovation speed. Both are essential; hard metrics show efficiency, while soft metrics indicate strategic value and sustainability.
How can I establish a baseline for measuring AI impact?
Before implementing any AI tool, document your current performance across relevant KPIs. Measure how long tasks currently take, the error rates in existing processes, and current customer satisfaction scores. Deloitte recommends tracking at least 12 KPIs pre-implementation. Without this baseline, you cannot accurately calculate the percentage improvement gained from AI adoption.
Does having a formal AI strategy really improve ROI?
Yes, significantly. Research from Thomson Reuters shows that organizations with formal AI strategies aligned to business goals achieve 2.3x higher ROI than those adopting AI informally. A clear strategy ensures that AI initiatives are targeted at specific business outcomes, making it easier to measure success and allocate resources effectively.
What role does employee satisfaction play in AI ROI?
Employee satisfaction is a critical soft ROI metric. When AI eliminates mundane tasks, employee satisfaction can increase by 18%, according to industry data. Higher satisfaction leads to lower turnover, better engagement, and improved quality of work. These factors indirectly drive revenue and reduce recruitment costs, contributing to long-term profitability.


Comments
Marissa Haque
Oh my gosh, this is EXACTLY what I have been trying to tell my boss for the last six months!!! 😭 It is so frustrating when they just look at the API costs and ignore the fact that our team is actually producing higher quality work. We need to talk about the soft ROI more!! The part about the law firm increasing billable hours by focusing on strategy instead of rote research? That is huge! 🤩
I feel like we are all stuck in Tier 1 metrics because it is easier to count tokens than to measure creativity or employee happiness. But if we don't shift our perspective, we are going to keep killing projects that are actually helping us grow. Can we please start documenting baselines before we launch anything?? It feels like such a basic step but everyone skips it! 💔
June 12, 2026 AT 03:47
Lisa Puster
typical american corporate fluff piece designed to justify wasting money on shiny new toys while actual productivity stagnates. the idea that 'soft roi' like employee satisfaction matters more than hard cash flow is naive at best and dangerous at worst. companies should be measuring output per dollar spent not how happy the workers are feeling. if your ai tool does not cut labor costs immediately it is a failure period. stop making excuses for bad management with buzzwords like 'strategic capability'. real business is about efficiency and profit margins not feelings.
June 12, 2026 AT 15:11
Michael Richards
You are missing the point entirely. This isn't about feelings, it's about cognitive leverage. If you only measure immediate cost savings, you are operating with an industrial-era mindset in a digital economy. The data clearly shows that organizations with formal AI strategies see 2.3x higher ROI. Ignoring the strategic alignment factor is why most projects fail. You need to track Tier 2 and Tier 3 metrics to understand the true value proposition. Stop being short-sighted.
June 13, 2026 AT 11:25
Laura Davis
Hey hey let's keep it respectful here folks! 👋 I think both sides have valid points but the article makes a really strong case for looking beyond just the bottom line in month one. Burnout is a REAL issue and if AI can help reduce that by taking over mundane tasks then that is a win for retention which saves money in the long run. Let's support each other in finding better ways to measure success! We are all learning together. 💪✨
June 14, 2026 AT 17:43
Lisa Nally
The epistemological framework presented here is fundamentally sound yet practically underutilized due to organizational inertia. When we discuss 'Tier 3: Revenue Impact', we must consider the attribution complexity inherent in multi-variable economic systems. The correlation between AI adoption and NPS scores is not merely coincidental; it represents a paradigm shift in customer-centric operational models. Furthermore, the dichotomy between hard and soft ROI is somewhat reductive. One might argue that employee satisfaction is a leading indicator of hard ROI via reduced turnover costs and increased engagement-driven productivity. Therefore, a holistic ontological approach to metric selection is imperative for sustainable competitive advantage. The EU AI Act's regulatory pressure further necessitates this transparency, transforming measurement from a discretionary analytical exercise into a compliance obligation.
June 15, 2026 AT 02:37
Edward Gilbreath
they want you to believe you need expensive consultants to measure this stuff its all a scam to sell more enterprise licenses. just use the tools and see if it works. if it saves time great if not dont use it. why do we need twelve kpis and baseline documentation for everything. people are overthinking this simple concept. the big tech companies are just trying to keep you hooked on their subscription fees by making you feel like you are failing if you dont have a complex dashboard. wake up.
June 16, 2026 AT 14:22
kimberly de Bruin
we measure what we fear losing rather than what we hope to gain. the obsession with quantifiable metrics blinds us to the qualitative shifts in human potential. ai is not just a tool for efficiency it is a mirror reflecting our own inability to define value beyond monetary exchange. perhaps the true roi is the liberation of the mind from repetitive drudgery allowing for deeper contemplation and creative expression. until we redefine success we will remain trapped in the cycle of vanity metrics.
June 17, 2026 AT 22:47
Edward Nigma
Actually the whole premise of tiered metrics is flawed because it assumes a linear progression of value creation which rarely exists in chaotic market environments. Most companies fail not because they lack strategy but because they implement rigid frameworks that stifle innovation. The suggestion that formal AI strategies yield 2.3x higher ROI is likely survivorship bias ignoring the countless agile teams that succeeded without heavy documentation. Plus who has time for weeks of baseline establishment in today's fast paced world. Adaptability beats planning every single time.
June 19, 2026 AT 01:36
Francis Laquerre
This discussion highlights a fascinating cultural divergence in how different industries perceive technological integration. In many European contexts particularly within the EU the emphasis on regulatory compliance and ethical measurement frameworks as mentioned regarding the EU AI Act is far more pronounced than in the US market. There is a growing recognition that sustainability and employee well-being are not just 'soft' metrics but critical components of long-term business viability. The dramatic shift towards automated attribution predicted by Gartner suggests a global convergence where transparency becomes the new standard for trust in AI initiatives across borders.
June 20, 2026 AT 18:26