Executive Dashboards for Generative AI ROI: Metrics Leaders Need to See

- Mark Chomiczewski
- 9 June 2026
- 7 Comments
You spent millions on generative AI tools. Your team uses them daily. But when the CFO asks, "What did we actually get out of this?" you’re stuck showing them a chart of login counts. That’s not enough anymore. The era of "vibe-based" AI metrics is over. If you can’t prove that your Generative AI investment is shifting the P&L or reducing risk, you’re going to face budget cuts.
The solution isn't more data; it's better structure. You need an Executive Dashboard specifically designed to track Generative AI ROI through three distinct tiers of value: adoption, productivity, and revenue impact. This isn't about counting how many times someone clicked 'generate.' It’s about connecting those clicks to time saved, errors reduced, and dollars earned. Here is exactly what leaders need to see in 2026 to secure continued investment and drive real business change.
The Three Tiers of AI Measurement
Most companies fail because they stop at Tier 1. They measure usage and call it success. But usage doesn't equal value. To build a dashboard that satisfies both IT leadership and the Board of Directors, you must layer your metrics across three specific tiers. Each tier answers a different question for a different stakeholder group.
Tier 1: Action Counts (The Baseline)
This tier answers the basic question: "Are people actually using our tools?" Without this baseline, you have no proof of adoption. However, these metrics are only useful for IT leadership and department heads, not for proving financial ROI.
- Daily/Weekly Active Users: Track unique users engaging with AI tools daily. Are new teams joining the platform?
- Interaction Volume: Count the number of AI interactions per user. High volume suggests integration into daily workflows.
- Feature Utilization: Which features are being used? If everyone uses the chatbot but no one uses the code assistant, your training or tool selection might be misaligned.
- Adoption Velocity: How fast are different departments adopting the tech? Identify power users and lagging teams early.
Track these metrics daily. Report them weekly to department heads. But do not present these numbers to the CFO as proof of value. They are merely the foundation.
Tier 2: Workflow-Time Saved (Productivity)
This is where the rubber meets the road. You need to connect AI usage to actual productivity improvements. According to research from Deloitte Global, IT, operations, marketing, customer service, and cybersecurity are the functions seeing the most advanced GenAI initiatives. But which ones save the most time?
Your dashboard must compare task completion times before and after AI adoption. Don't just guess. Use workflow tracking software to measure the delta. For example, if a support agent used to take 15 minutes to draft a response and now takes 4 minutes with AI assistance, that’s 11 minutes saved per ticket. Multiply that by 10,000 tickets a month, and you have tangible hours back in the day.
Crucially, you must track quality alongside speed. Did the AI make the work faster but introduce more errors? If so, the net value is negative. Measure defect rates, revision cycles, and customer satisfaction scores (CSAT) concurrently with time savings. This tier should be tracked monthly and reported to the executive team.
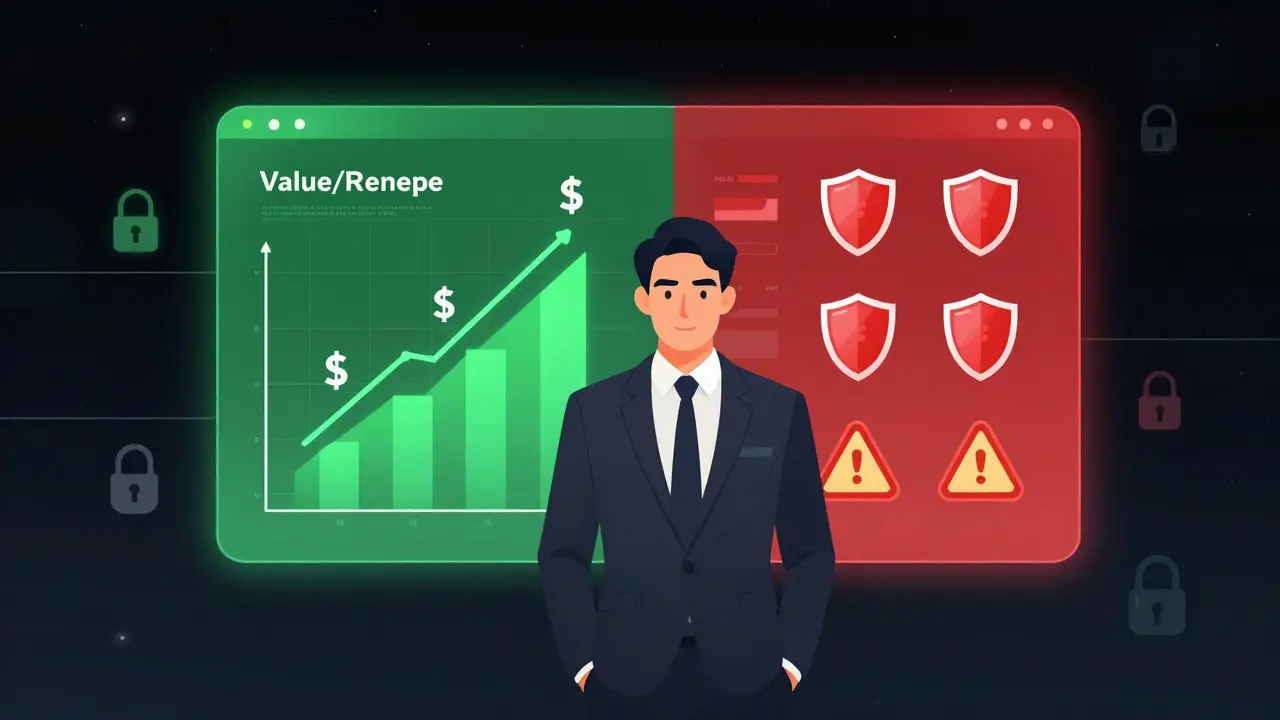
Tier 3: Revenue Impact (The Bottom Line)
This is the metric that keeps your funding. Tier 3 connects AI adoption directly to financial performance. Boards and C-Suite executives care about two things: revenue uplift and margin improvement. Your dashboard needs to show causation, not just correlation.
| Metric | Definition | Why It Matters |
|---|---|---|
| Revenue Per Employee | Total revenue divided by headcount, compared pre- and post-AI. | Shows if AI is enabling employees to generate more value without hiring more staff. |
| Cost Per Process | The average cost to complete a specific workflow (e.g., contract review). | Demonstrates direct efficiency gains and operational cost reduction. |
| Deal Closure Rate | Percentage of leads converted to sales, segmented by AI-assisted vs. non-assisted. | Proves AI's impact on top-line growth in sales functions. |
| Risk-Adjusted EBIT Lift | Earnings Before Interest and Taxes increase, adjusted for potential AI risks. | Provides a holistic view of profitability including risk mitigation. |
Advanced organizations use predictive analytics here. Based on current adoption curves, forecasted cost savings at full adoption, and predicted competitive advantage timelines, you can project future ROI. This turns your dashboard from a rear-view mirror into a GPS for strategic planning.
Balancing Value, Trust, and Adoption
A common mistake is focusing solely on speed and money. This ignores the "Trust" component of AI implementation. As Bhubalan Mani, Lead of Supply Chain Technology and Analytics at GARMIN, points out, AI evaluation KPIs must include trust metrics like incident rates, bias detection, and regulatory findings. If your AI saves money but gets sued for copyright infringement or leaks sensitive data, the ROI is irrelevant.
Sabarinath Yada from Accenture emphasizes a balanced scorecard approach built around five key areas: business impact, adoption, quality, human-AI collaboration rate, and risk/governance. Your dashboard should include a "Health & Risk" section alongside the financial metrics. Track:
- Incident Rates: How often does the AI produce hallucinations or incorrect outputs that require human correction?
- Data Privacy Breaches: Any unauthorized access or leakage of sensitive information?
- User Confidence Score: Survey users quarterly on their trust in AI recommendations. Low trust kills adoption, regardless of accuracy.
When you present this balance to the board, you show maturity. You’re not just chasing hype; you’re managing a strategic asset responsibly.

Building the Dashboard: A Phased Approach
You don’t need to build everything overnight. A phased rollout over 12 months ensures data integrity and stakeholder buy-in. Rushing to Tier 3 metrics without solid Tier 1 and 2 foundations leads to inaccurate reporting and loss of credibility.
- Phase 1: Foundation (Months 1-2)
Implement Tier 1 metrics. Build the dashboard infrastructure. Secure baseline data for all key workflows. Focus on getting accurate usage counts and identifying active users. - Phase 2: Productivity Link (Months 3-6)
Introduce Tier 2 metrics. Implement workflow time tracking. Establish quality measurement baselines. Start correlating usage spikes with output changes. Report monthly productivity gains to executives. - Phase 3: Optimization & Scale (Months 7-12)
Implement Tier 3 business impact metrics. Achieve full ROI measurement capability. Use advanced correlation analysis to link AI usage to revenue and cost reductions. Scale successful approaches across the organization.
In Phase 3, you should also integrate predictive analytics. Tools like Qlik’s executive dashboard solutions or Figma’s AI generator can help visualize complex data relationships. But remember, the tool is secondary to the logic. Ensure your data sources-ERP systems, MES (Manufacturing Execution Systems), IoT sensors, and CRM platforms-are integrated cleanly.
Industry-Specific Adaptations
Generic dashboards fail because they ignore industry context. In manufacturing, for instance, executives are replacing manual reporting with generative AI dashboards that integrate ERP and IoT data. The KPI targets here might include machine downtime reduction, supply chain delay predictions, and energy consumption optimization. The implementation strategy involves selecting a pilot plant, defining KPI targets, integrating data sources, fine-tuning language models with operational documents, and then expanding plant-by-plant.
In software development, the focus shifts to code generation speed, bug detection rates, and deployment frequency. In marketing, it’s about content production volume, campaign conversion rates, and customer engagement scores. Tailor your Tier 2 and Tier 3 metrics to your specific vertical. A "time saved" metric means something very different in a call center versus a research lab.
Communicating ROI to Stakeholders
How you present the data matters as much as the data itself. CFOs speak the language of finance. Instead of saying "Users love the AI tool," say "AI delivered $8M in productivity value on a $2M investment, resulting in a 4x ROI." Frame every metric in terms of value generated versus investment.
For boards, emphasize strategic advantage. Show how AI is accelerating capability development pace and creating long-term value trajectories. Highlight competitive positioning implications. If your competitors aren’t measuring AI ROI rigorously, your ability to optimize based on hard data gives you a significant edge.
Remember, accountability has replaced experimentation as the dominant organizational concern. Executives who can demonstrate measurable AI ROI with clear value realization will secure continued investment. Those stuck with vague metrics face budget cuts. Your dashboard is your evidence. Make it count.
What is the most important metric for AI ROI?
While adoption metrics are foundational, the most important metric for true ROI is revenue impact or cost reduction per process. These Tier 3 metrics directly tie AI usage to financial outcomes, which is what executives and boards ultimately care about. Without linking AI to the bottom line, you cannot prove sustainable value.
How often should AI ROI metrics be updated?
Update frequencies vary by metric type. Adoption rates (active users) should be tracked daily. Usage patterns and session durations should be reviewed weekly. Productivity gains (time saved) should be calculated monthly. Business impact metrics (revenue correlation, cost reduction) are typically tracked quarterly for board and C-Suite reporting.
Can I measure AI ROI without specialized software?
You can start with basic spreadsheets and manual time-tracking surveys, but this is prone to error and lacks scalability. For accurate Tier 2 and Tier 3 metrics, you need integrated data sources (CRM, ERP, workflow tools) feeding into a centralized dashboard. Tools like Power BI, Tableau, or specialized AI analytics platforms automate this aggregation and provide more reliable insights.
What are "Tier 1" AI metrics?
Tier 1 metrics are "Action Counts" that establish baseline adoption. They include daily/weekly active users, number of AI interactions per user, feature utilization rates, and geographic or departmental adoption patterns. These answer the question: "Are people using the tool?" but do not yet prove business value.
How do I calculate AI productivity gains?
Calculate productivity gains by comparing task completion times before and after AI adoption. For example, if a task took 60 minutes manually and now takes 20 minutes with AI assistance, you’ve saved 40 minutes. Multiply this time saving by the hourly wage of the employee and the frequency of the task to estimate monetary value. Always validate this with quality metrics to ensure speed didn’t compromise accuracy.


Comments
Edward Gilbreath
they want you to believe metrics matter but its all just data harvesting for the algorithm gods who decide your worth in real time stop measuring and start questioning why we are slaves to productivity charts
June 9, 2026 AT 22:50
kimberly de Bruin
the dashboard is a mirror reflecting our collective anxiety about being obsolete we measure because we fear the void where meaning used to be before the machines took over our cognitive labor
June 10, 2026 AT 23:45
Edward Nigma
Actually this whole tiered approach is fundamentally flawed. You cannot quantify creativity or strategic insight with simple time deltas. The article assumes that speed equals value which is a dangerous fallacy. Most of these 'savings' are actually just shifting the bottleneck from execution to oversight. Also ur spelling is bad in the examples.
June 12, 2026 AT 00:42
Francis Laquerre
In my experience across European tech hubs, the cultural resistance to Tier 3 metrics is far greater than the technical challenge. People do not trust what they cannot see happening in real time. We must build a narrative of transparency alongside the numbers. It is dramatic but necessary for adoption.
June 12, 2026 AT 12:23
michael rome
I completely agree with the phased approach. It is essential to respect the boundaries of current infrastructure while motivating teams to embrace change. Rushing into revenue impact without solidifying the baseline often leads to burnout and inaccurate data. Let us proceed with caution and empathy for the staff adjusting to new workflows.
June 14, 2026 AT 10:31
Andrea Alonzo
It is so important to remember that behind every metric is a human being trying to adapt to a rapidly changing landscape, and when we focus solely on the bottom line without considering the emotional toll of constant surveillance and performance tracking, we risk creating a toxic environment where innovation stagnates because people are too afraid to make mistakes, and I have seen this happen in multiple organizations where the pressure to show immediate ROI led to short term gains but long term loss of talent and trust.
June 16, 2026 AT 05:32
Saranya M.L.
Your understanding of GenAI ROI is superficial at best. In India, we integrate AI into supply chain logistics with precision engineering that dwarfs your simplistic three-tier model. You ignore the critical role of governance frameworks specific to emerging markets. Without robust bias detection protocols aligned with local regulatory standards, your dashboard is useless. Learn from global leaders instead of preaching basic concepts.
June 16, 2026 AT 06:18